Capstone Course Project
Overview
Undergraduate
This seminar course is a senior level course designed to allow you to review, analyze, and integrate the work you have completed toward a degree in analytics. You will complete an academic project and present a paper that demonstrates mastery of your program of study in a meaningful culmination of your learning.
You should begin work on your Course Project in Week 3; there is no deliverable in Week 3 but it's a good idea to start now to stay on track. Your course project will consist of the following components, along with their recommended or required deadlines:
Week 5: Part 1: Introduction and Analysis
Pick a Topic: You should start by deciding upon the topic of your course project. You're welcome to choose any of the case studies we'll be looking at in the first few weeks of the course as the topic of your course project. In addition, you're also free to instead pick a separate dataset of your own choosing for your topic. Ideally, you should choose a topic, either based on the case studies or using a separate dataset of your own liking, that interests you or is part of your professional experience, as well.
As you progress through the course, you'll add the analysis for the topic you're chosen. In particular, you'll decide upon some research question in which you find a relationship or make a recommendation, as discussed below. Please note: even if you pick your own topic, you'll still have to complete all the case studies.
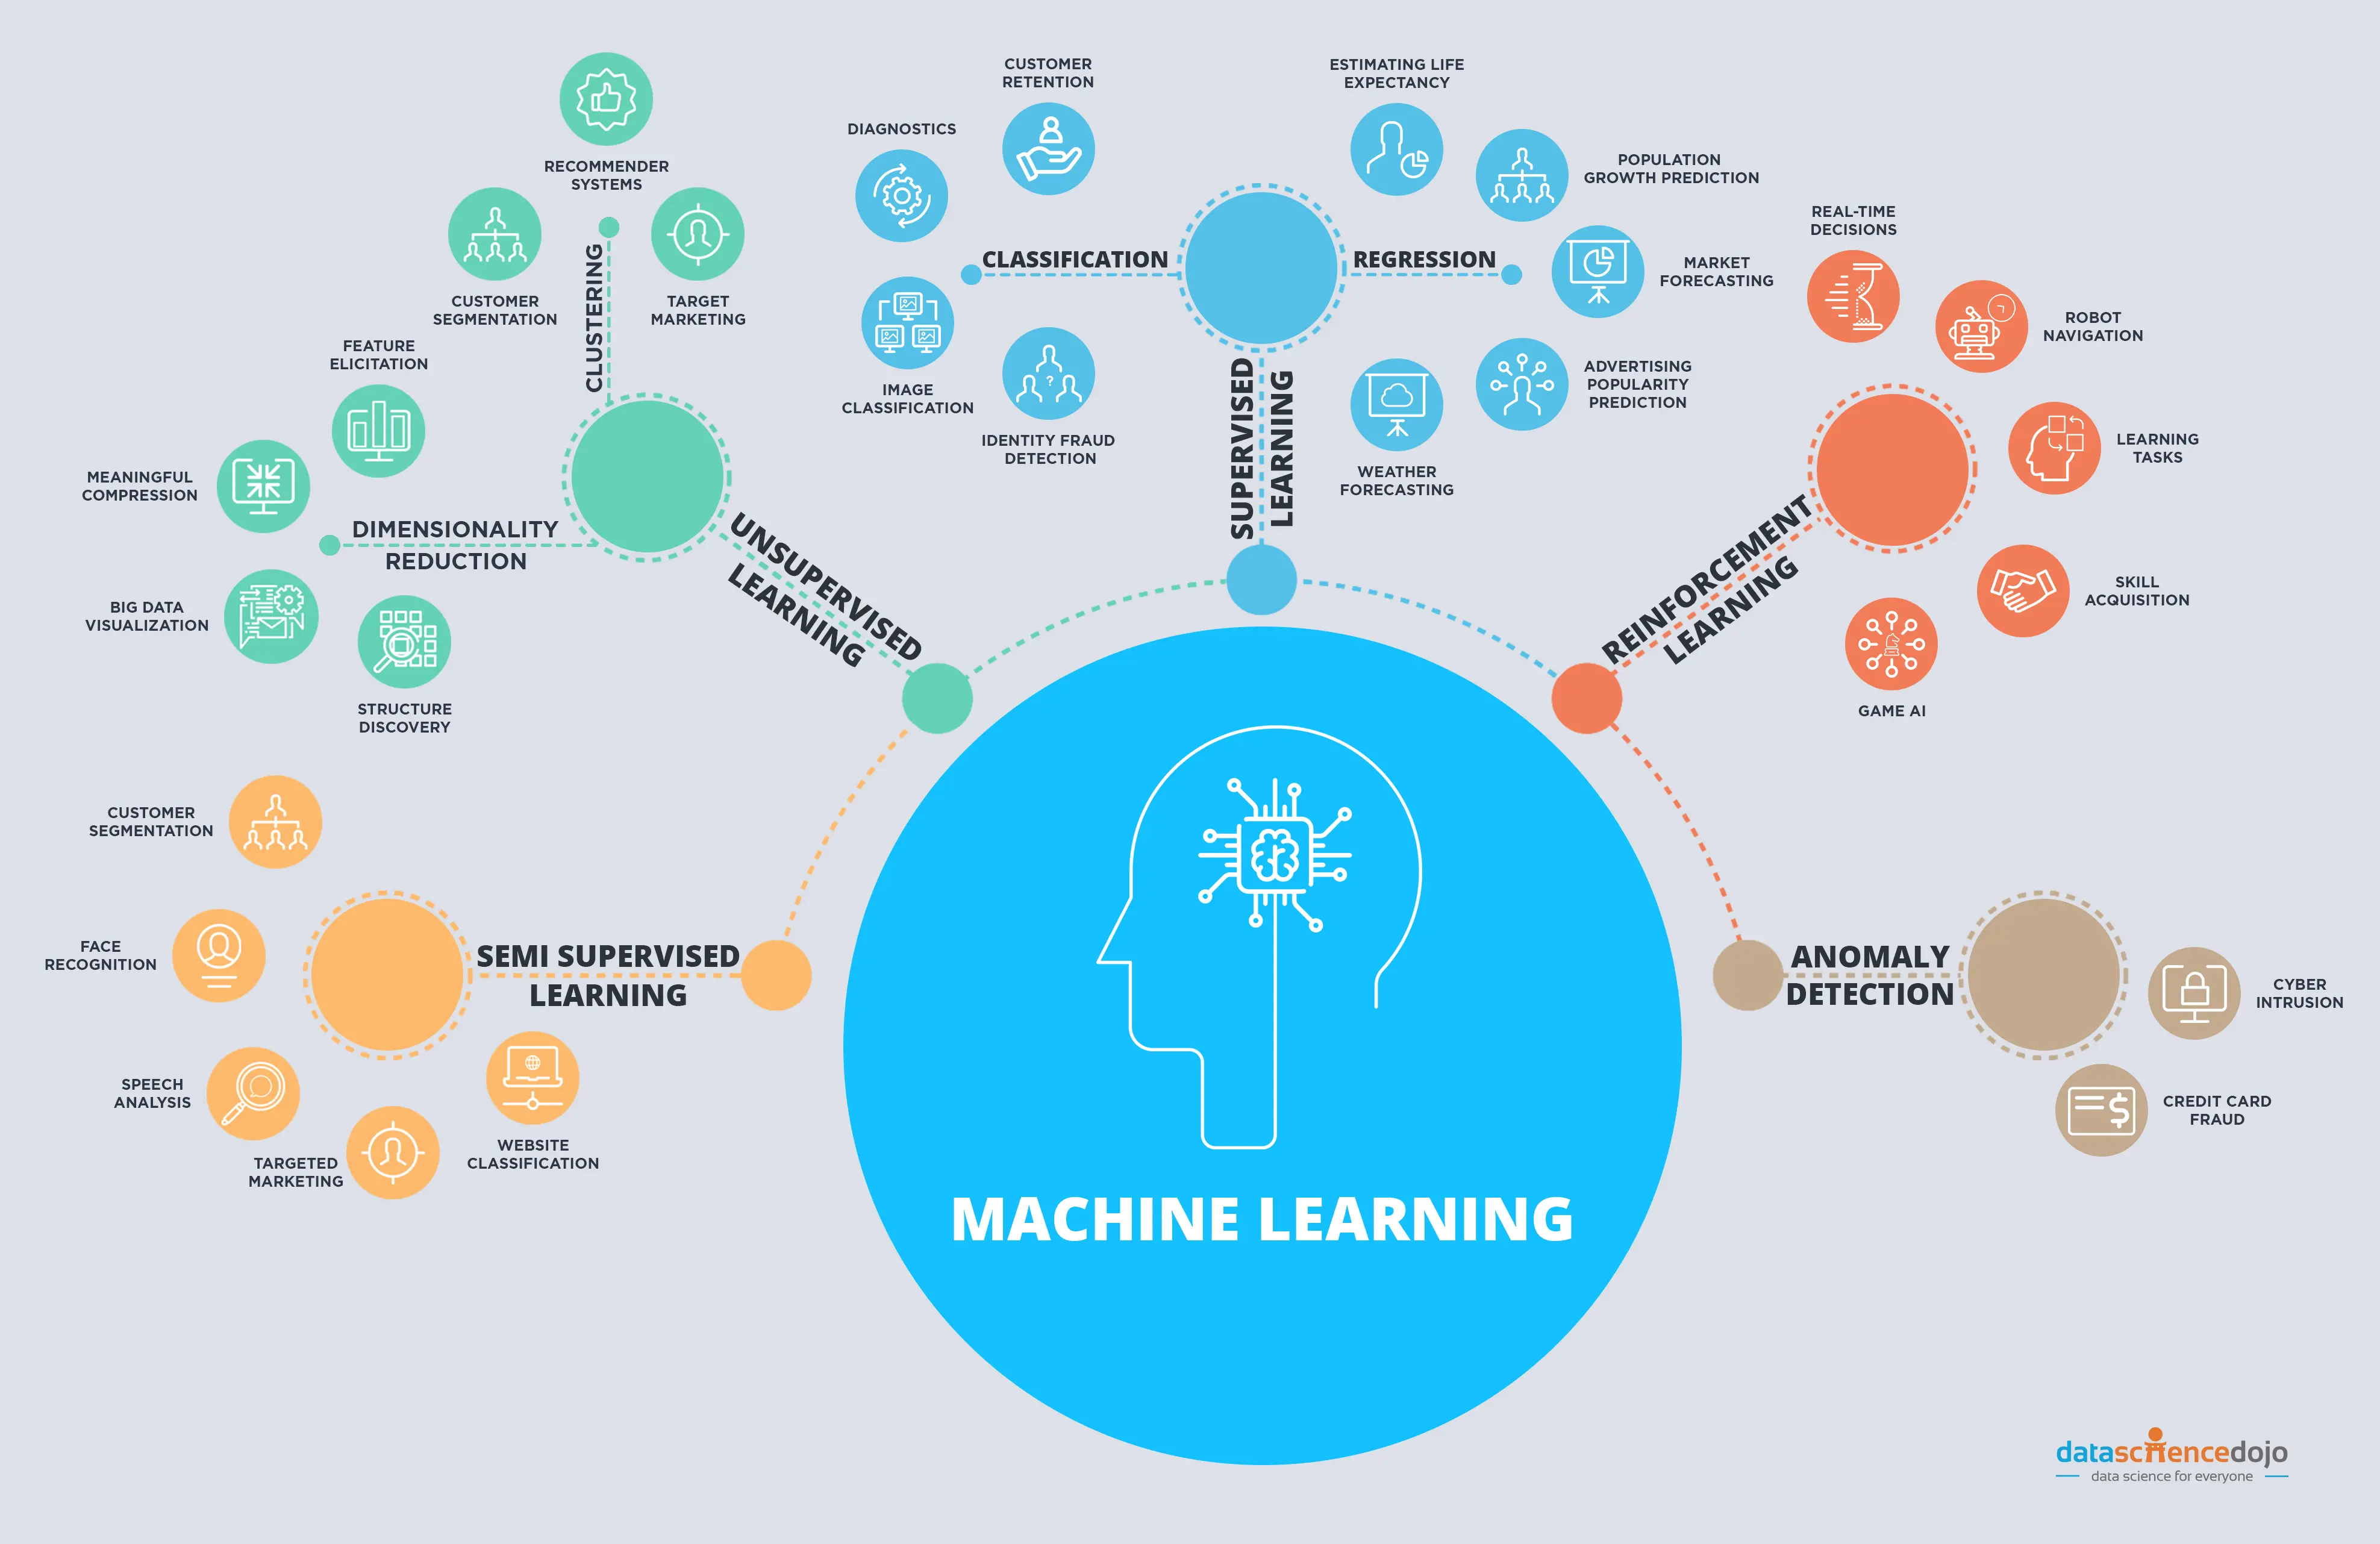
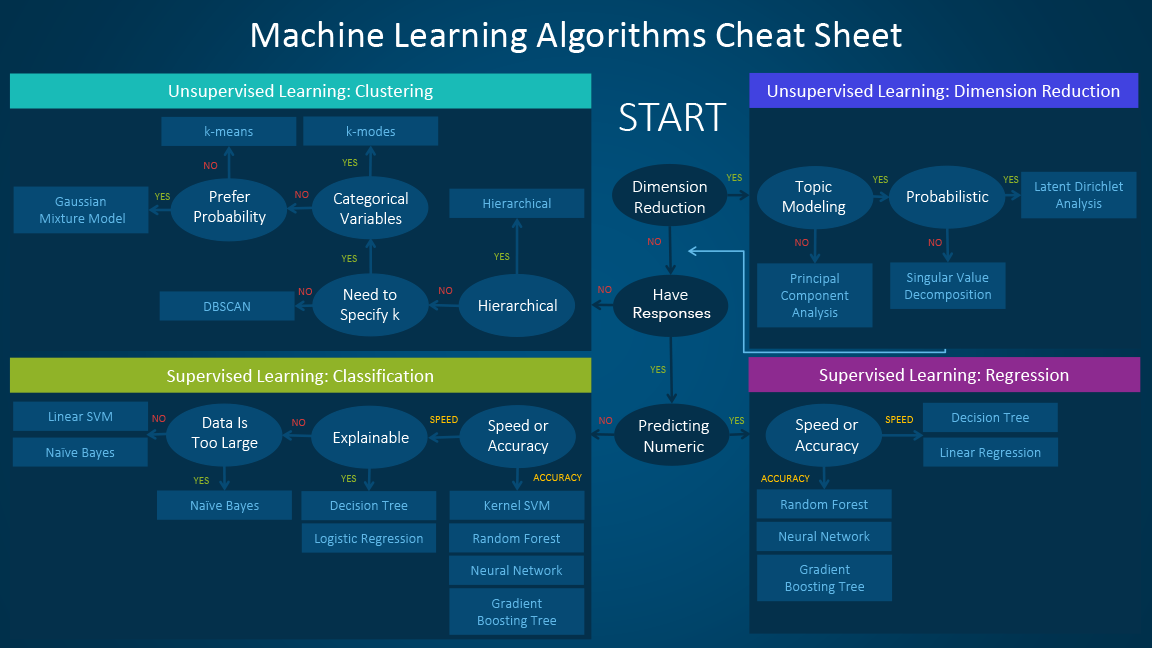
The secondary analyses should be approaches like linear regression, multiple linear regression, random forest, etc. Please see the Machine Learning and Tips sections below for more potential approaches.
Machine Learning Resources: You can see some general resources for machine learning here: https://www.sethi.org/classes/pub/resources/ml-resources.html In addition, you can see the Machine Learning chapter of my book, http://research.sethi.org/ricky/book/, which is freely available on ResearchGate here.
Potential Dataset Sources: Some sample dataset sources are also linked here: https://www.sethi.org/classes/pub/resources/project_topics_datasets.html
Week 7: Part 2: References
For the References section of your paper, please use the resources available to you in the library to ensure you find quality sources. Remember that you need to collect quite a few resources for your project and they should be quality resources. You should also find some data sources to support your analysis at this point.
Week 9: Part 3: Literature Review
Week 12: Part 4: Findings/Recommendations
Week 13: Part 5: Formatting
Week 15: Part 6: Revisions
Week 16: Part 7: Final Submission
Graduate
The purpose of this capstone course is to provide an opportunity for students to integrate the knowledge gained completing various courses in Analytics. Students are expected to complete an approved project that demonstrates mastery of course concepts and their applications. Students should complete all required coursework prior to this course.
Your course project will consist of the following components, along with their recommended or required deadlines:
Week 2: Identify data sources
Potential Dataset Sources: Some sample dataset sources are also linked here: https://www.sethi.org/classes/pub/resources/project_topics_datasets.html
Week 3: Describe analytical concepts and tools: in addition to approaches like linear regression and multiple linear regression, you can use approaches like SVMs, random forest, etc. Please see the Machine Learning and Tips sections below for more potential approaches.
Machine Learning Resources: You can see some general resources for machine learning here: https://www.sethi.org/classes/pub/resources/ml-resources.html In addition, you can see the Machine Learning chapter of my book, http://research.sethi.org/ricky/book/, which is freely available on ResearchGate here.
Week 4: Write a proposal for the selected project
This is when you'd formulate the research question. One approach to formulating the research question is to start with your chosen dataset and then thinking about what kinds of questions an analytical technique (like Linear Regression, Logistic Regression, SVMs, etc.) can help answer on that dataset.
Week 5: Detailed literature review of the selected analytical theory/concept/tool
Week 6: Submit the Project Plan, a word document identifying key milestones for the project such as data collection, data review, data analysis, etc., along with timelines to complete them
Week 7: Submit final peer-reviewed references list
Week 8: Submit final dataset with any applicable IRB approvals
Week 10: Submit the Descriptive Analytics stage
Week 11: Submit the Analytics stage
Week 12: Submit the Prescriptive Analytics/Theorised stage
Week 13: Submit a First Draft of your final paper
Week 15: Submit final paper
Submission Format
Undergraduate
Your paper should be written in a case study format and contain the following sections, at a minimum:
Introduction: including the Problems/Issues you're trying to solve
Background: including the Literature Review
Analysis: including the Results and Findings from the main model
Alternative Models: including their Results and Comparison to the main model
Recommendations
The paper should be formatted following APA guidelines and be between 6 - 10 pages in length, not including the bibliography or datasets used. Any data and calculations should be included separately in an Excel file.
Graduate
For graduate level work, the paper should include the following sections:
Table of Contents and Lists of Figures/Tables
Section I: Introduction
Background and Problem Statement
Section II: Body
Literature Review
Data
Methods
Analysis (three stages: descriptive, analytic, and prescriptive/theorised)
Results
Section III: Conclusion/Discussion
Appendices
Reading & Resources
Here are some additional helpful resources that might prove useful, as well:
Tips
Depending on the kind of problem you're analyzing, you'll likely want to do something akin to the following.
Perform exploratory data analysis using descriptive statistics and visual displays to identify factors that influence the goal. Make sure your analysis provides answers to the questions listed below:
Obtain the summary statistics for the variables and comment on them. Be sure to calculate the mean, median and mode for the relevant factors.
Are there outliers in the data for the variables?
What is the best measure of central tendency that you will use to describe the relevant factors?
Create distributions for the relevant variables. Comment on the distributions of data for the variables? Are they symmetrical? Skewed?
Obtain the correlations between variables and comment on them. Present the data for the relevant variables using appropriate charts. Justify your choice for each variable.
Identify any relationships you find between the variables.
Use simple or multiple linear regression technique, or other analytical techniques, to identify the cause and effect relationship between those variables. State the regression equation and interpret the regression coefficients. Comment on the goodness of fit of the regression equation for the data.
Use it to predict future values of the relevant variables.
If you have a time series, then you might want to instead:
Obtain the summary statistics for both variables and comment on them.
Create time-series plot of the relevant variables by the appropriate time period increment.
Comment on the trend(s) you see on the chart.
Create other diagrams like scatter diagrams for the response variables and the predictor variables? Ae the variables related to each other?
Determine the correlation between the variables and comment on the nature and strength of relationship between them.
Use techniques like multiple or simple linear regression technique to identify the cause and effect relationship between the relevant variables.
Comment on the goodness of fit of the regression equation for the data. Do you think your prediction(s) are accurate?
Machine Learning Guides
Please do feel free to see the Machine Learning chapter of my book, which is freely available on ResearchGate here, and has an overview of the machine learning process and summary of some fundamental machine learning approaches.
There are many machine learning techniques you can employ but some might be more complex or difficult to implement than others. Here is a summary of some of the more popular and effective approaches.

Which machine learning algorithm should I use? https://blogs.sas.com/content/subconsciousmusings/2020/12/09/machine-learning-algorithm-use/

Introduction to Machine Learning Algorithms for Beginners: https://huspi.com/blog-open/guide-to-machine-learning-algorithms
Top 10 Algorithms every Machine Learning Engineer should know: https://www.geeksforgeeks.org/top-10-algorithms-every-machine-learning-engineer-should-know/
101 Machine Learning Algorithms for Data Science with Cheat Sheets: https://www.r-bloggers.com/2019/07/101-machine-learning-algorithms-for-data-science-with-cheat-sheets/
Machine Learning Interview Questions and Answers: https://www.mygreatlearning.com/blog/machine-learning-interview-questions/
Paper Formatting Tips
In your final paper, please do include a separate Table of Contents, List of Figures, and List of Tables. You can see how to make them here:
List of Figures: https://www.youtube.com/watch?v=kQSJgc-Tsqs
List of Tables: https://www.youtube.com/watch?v=rgb7qHRJeow
How to Create and Update a List of Tables or Figures in Microsoft Word: https://erinwrightwriting.com/how-to-create-and-update-a-list-of-tables-or-figures-in-microsoft-word/
There is some flexibility in the styling, of course, but, in the end, you should have a Table of Contents, a List of Tables, and a List of Figures, somewhat like the following:

In addition, you can refer to these guides on APA in general, as well:
Purdue OWL: APA Formatting - The Basics: https://www.youtube.com/watch?v=pdAfIqRt60c
Purdue OWL: APA Formatting: Reference List Basics: https://www.youtube.com/watch?v=HpAOi8-WUY4
APA Citation Style Guide (7th ed.): Paper Format Guidelines: https://guides.douglascollege.ca/APA-7/PaperFormatGuidelines
How to format tables and figures in APA Style: https://www.scribbr.com/apa-style/tables-and-figures/
How to Create a Table of Contents in APA Style: https://cbc.instructure.com/courses/858579/pages/how-to-create-a-table-of-contents-in-apa-style?module_item_id=35165532