Machine Learning/Research Question Overview
Machine Learning Problem Formulation Flowchart
What is the business or research problem?
Develop a research question: delineate what to predict or estimate: a precise, quantitative prediction that can be validated
Start by finding a problem domain and the business issue (business does not mean commercial enterprise but rather any organization)
Then, frame the business problem appropriately: Determine the objectives and what will be considered a successful solution
How is the success of a solution to the business problem measured?
Do you have data to help answer that particular business/research problem?
First, gather the data: find or sample relevant datasets
Understand the data: do some initial Exploratory Data Analysis (EDA): visualize data, detect anomalies, identify patterns
This includes data cleaning and data wrangling/munging on both the original dataset and the new, unseen data, including things like removing noise, normalizing values, and handling missing data.
Based on your dataset analysis, what are the specific independent and dependent variables?
Is it a machine learning (ML) problem?
Does it answer one of the questions ML can address?
Which ML categories/approaches seem appropriate for this problem?
Is it batch or online?
What are some evaluation metrics that might be appropriate for that ML category/approach?
What is your final research question?
Is your research question specific and measurable?
Can you fully formulate it as a ML research question that answers one of the common questions ML approaches answer and has appropriate quantifiable metrics?
Do the evaluation metrics align with the business/research objective?
Is there a minimum performance needed to meet the business objective?
Are there any assumptions in the solution so far?
Make the predictions: develop a predictive model by building, fitting, and validating the appropriate algorithm
This also involves carrying out feature engineering and hyperparameter tuning, as appropriate.
Train your selected models on the training set and tune their hyperparameters using the validation set.
Evaluate the trained models using appropriate metrics and use techniques like cross-validation to ensure the models' performance is consistent across different data subsets.
Create the final model and use that final model to make your final prediction.
Difference between Qualitative and Quantitative Research Questions
The first step, before applying any machine learning, would be to develop your research question, which would depend on what kind of research you're going to do, usually either a qualitative or quantitative research design.
Start with a qualitative research question: look broadly at the topic and ask WHAT and HOW questions
Exploratory Data Analysis (EDA) is usually this kind of research where you explore, describe, or summarize/understand the phenomenon
Then, narrow in on a specific quantitative research question: identify the independent and dependent variables and think in terms of causal or correlative effects between the two
The quantitative research question establishes relationships between variables
The quantitative hypotheses are the basis for your predictions about the relationship between the independent and dependent variables
The predictions are the numeric estimates validated via some experiment or empirical analysis
Converting a Business Problem to a Machine Learning Research Question
The research question should be falsifiable or tested scientifically, whether for a class project or for a PhD dissertation. It should be formulated as one of the 8 common questions machine learning answers, as seen below:
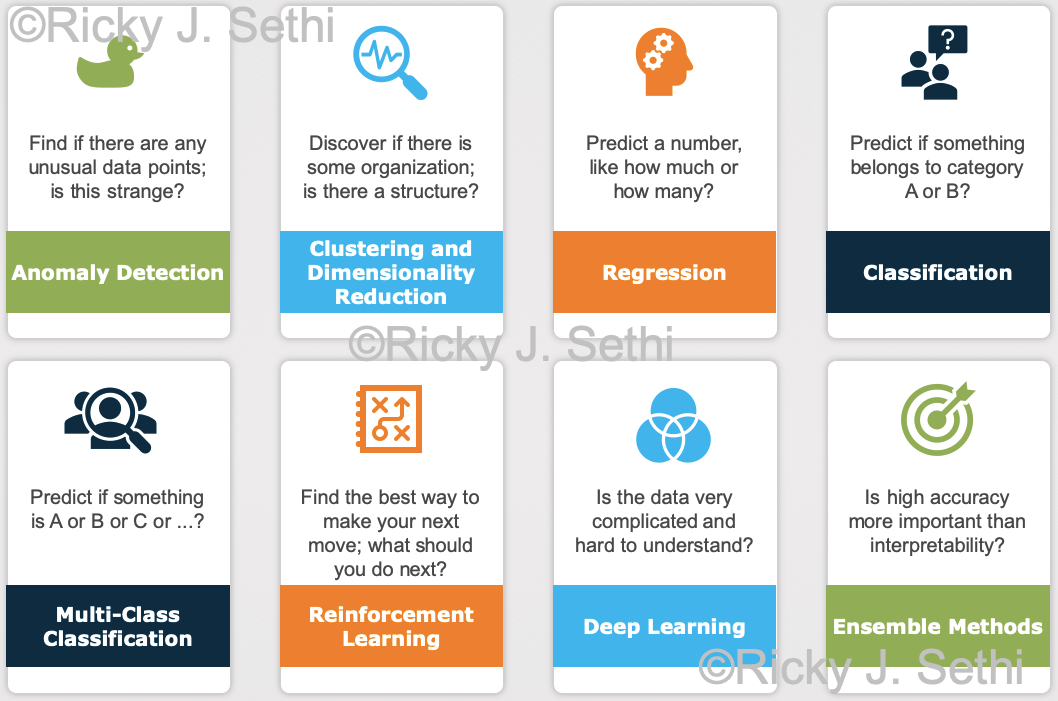
It should also identify the predictor and response variables. So, in the end, you should formulate a falsifiable hypothesis that can be tested with quantitative data.
For example, if your research question is vague, it doesn't have to be answered with a category label or a number. When thinking about a good research question, people often imagine they've found a mischievous genie who will truthfully answer all questions but will also try to make the answer vague and confusing. So they'll try to pin the genie down with a question so airtight that the genie has no choice but to answer insightfully.
So if you asked a vague question like, "Is there a correlation between stock prices and time?", the genie might answer, "Yes, the price will change with time." Although correct, this answer's not very helpful. But if you formulate a precise, quantitative question like, "Will my stock hit $50 by next Wednesday?", the genie has no choice but to give a specific answer and predict the stock's price.
Thus, as you start to formulate your machine learning research question, you'll likely increasingly sharpen your initial ideas by going through these steps:
It helps to start by first stating the business problem. Business, as always in these contexts, doesn't mean a commercial enterprise but any enterprise, whether it's academic, industrial, or governmental.
At this stage, the specific, measurable business outcome(s) should be clearly identified, as well as any quantifiable, actionable Key Performance Indicators (KPIs) that are relevant to the business problem.
E.g., some traditional problems might be questions like: What factors are related to employee churn? Can we predict the number of employees that might leave the organization in the next year?
Then, convert that business problem into an initial problem statement by making it precise and quantitative and something you can use with a machine learning model.
In general, the initial problem statement should be precise and quantitative and is often expressed as some independent variable(s) (the predictor(s)) having a presumed correlation with some dependent variable (the response variable or class label).
E.g., is there a correlation between the predictor variables of (age, length of service, and business unit) with the response variable of (terminated status) of an employee?
Once you have a precise, quantifiable question, you will have to finally fine-tune it to match one or more of these questions that machine learning usually answers, as shown above. Once you decide which of those questions it fits, you'll formulate your initial machine learning research question which will consider the independent variables, the dependent variables, and the metrics for evaluating the performance.
E.g., you might start with asking how likely is it that someone under 50, with more than 20 years service, working in the IT Department will leave within a year? This would be an example of a regression task where you predict a number (a probability) but you can also convert it to a classification task where you predict a category label, whether that person belongs in category A or category B (active employee or inactive employee).
The final version of this classification machine learning research question could then be something like:
Can the indepenent variables of (number of projects, recently promoted, job satisfaction, number of filed complaints, and average monthly hours worked) predict with over 90% precision and 90% recall the state of the dependent variable of (active employee status) for staff in the IT department?
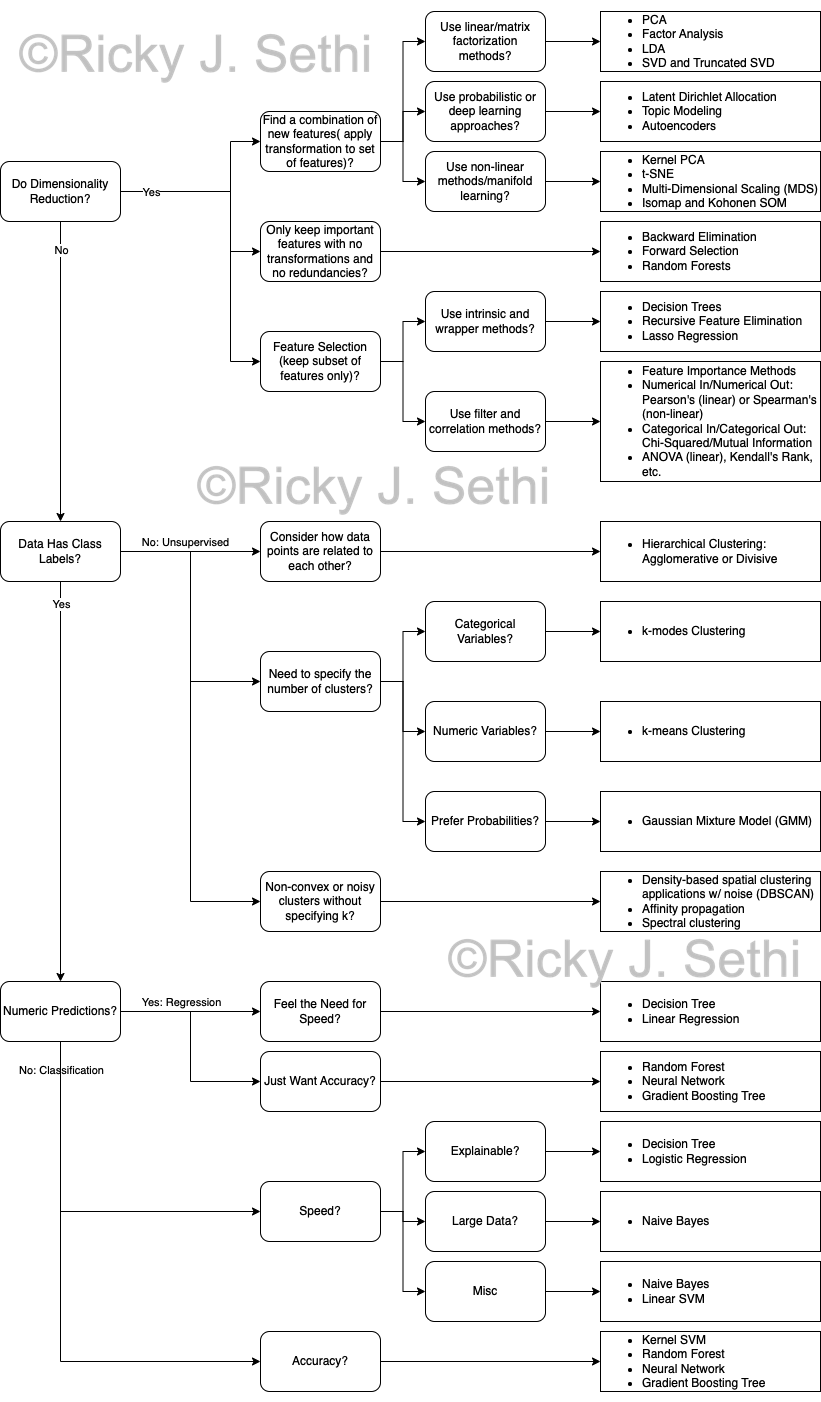
It can sometimes be a little confusing which machine learning algorithm to pick; here is a general flowchart of how to pick a machine learning algorithm that might be helpful:
Converting a Research Question into a Hypothesis
It’s generally good practice to try to position the independent variable(s) to appear first in the sentence followed by the predictive effect and then the dependent variable(s) as this ordering reflects the hypothesised direction of the effect, as well. Here are some examples of good and bad research questions.
Here is a better example of a Research Question from the dissertation of Charles Courchaine:
"To what extent, if any, does document encoding affect the recall, precision, F1, and recall-at-effort metrics of a Fuzzy ARTMAP-based TAR algorithm?"
And here is its corresponding hypothesis couplet, as discussed below, as well:
: Different document encodings (tf-idf, GloVe, Word2Vec, SBERT) will not change the recall, precision, F1, and recall-at-effort metrics of a Fuzzy ARTMAP-based TAR algorithm.
: Different document encodings (tf-idf, GloVe, Word2Vec, SBERT) will change the recall, precision, F1, and recall-at-effort metrics of a Fuzzy ARTMAP-based TAR algorithm. Corpus specific document encodings (e.g., tf-idf) will improve performance metrics, while non-corpus specific encodings perform the same or worse.
Overall, you should try to:
Establish the theoretical/conceptual framework that will serve as the basis, or context, for your answer to the research question
This rationale or model is what informs the context for your final prediction, which is based on the hypothesis
Formulate your answer as a clear description of the relationship between the variables of interest in your study
These variables will later be categorized as the independent (predictor) variables and the dependent (response) variable(s)
Write the predicted answer to your research question as an If-Then formulation
This will help classify the variables: the if-part will contain the independent variables and the then-part will contain the dependent variable(s)
E.g., If a first-year student starts attending more lectures, then their exam scores will improve.
Re-phrase it next as a correlation with the evaluation metric
Usually stated as: There is a significant effect of the independent variable(s) on the dependent variable(s)
E.g., First year students attending at least 70% of lectures have exam scores that are at least 30% higher than those who don’t.
Convert it to a Hypothesis Testing framework with the associated hypothesis couplet:
This should consist of the Research Question (as the one given above), followed by the Null and Alternative Hypotheses, as shown below.
Null Hypothesis,
E.g., Attendance of at least 70% of lectures by first-year students has no effect on their final exam scores.
Alternative Hypothesis,
E.g., Attendance of at least 70% of lectures by first-year students has a statistically significant increase of at least 10% on their final exam scores.
Statistical Significance
Once you have your null and alternative hypotheses in hand, it's time to make a decision on which to reject. How do you go about deciding in this case? In the NHST framework, you start by assuming the null hypothesis (that there's no correlation or effect between the variables in the original population) is true. Next, you gauge the relationship between the variables in the sample taken from that population by computing some statistic on that sample.
If the likelihood of that value for that test statistic on that sample is extremely unlikely, you reject the null hypothesis (otherwise, you retain the null hypothesis as you fail to reject it). This likelihood of the sample result if the null hypothesis is true is measured by the p-value, the probability of obtaining that sample result if the null hypothesis is true.
If the p-value is lower than some pre-determined threshold,
Thus, if the probability of getting that test statistic value is very low (lower than alpha), you reject the null hypothesis. Here is an excellent page that shows examples of how to craft null hypotheses and alternative hypotheses as well as which statistical tests (like t-tests, z-tests, linear regressions, etc.) are associated with the most popular studies.
Statistical Testing Options
This is one of the best references for Choosing the Right Statistical Test, that details both the different types of tests and examples for when they're most appropriate. In addition, it includes several tables that detail the statistical assumptions for these tests, the data types of independent and dependent variables (whether categorical, quantitative, or categorical) which influence which test is most appropriate for your study, and the difference between parametric and non-parametric tests; the parametric statistical tests cover regression (linear and logistic regression tests), comparison (t-tests, ANOVA, and MANOVA tests), or correlation (Pearson's r) tests, as summarized in their diagram below.
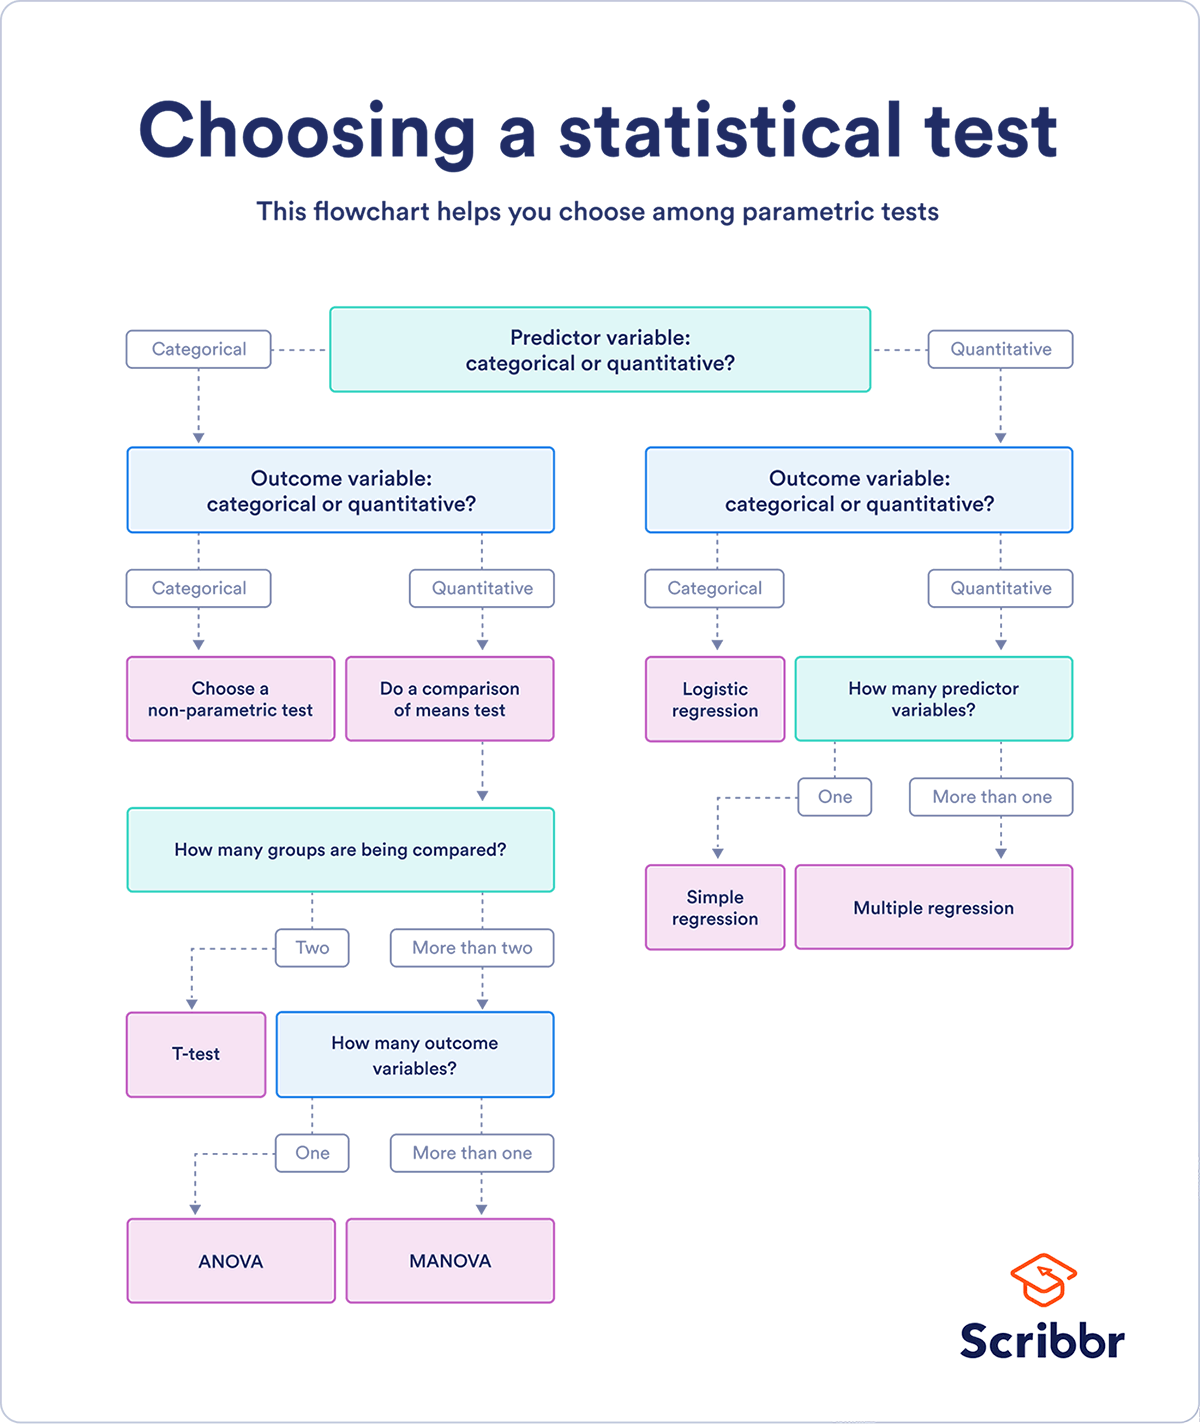
However, when you can't make the assumptions about the data that are required for the parametric statistical tests, you can instead use the non-parametric equivalents of most of those parametric tests by using tests like Spearman’s r (instead of Pearson's r), Chi-square (categorical-categorical), Sign test or Wilcoxon (instead of t-test), Kruskal–Wallis or ANOSIM (instead of ANOVA or MANOVA), etc.
Scientific Method/Falsifiability?
A hypothesis is a preliminary/tentative causal explanation between the variables in an observation.
The prediction is derived from the hypothesis in a particular experimental setting.
A prediction is a “Testable proposition that can be accepted or rejected on the basis of empirical observations derived from your study”
This can be falsified by comparing our guess/prediction to the actual result.
Machine Learning vs. Data Science
ML problem makes predictions
DS problem makes decisions, as well
Examples:
| Prediction | Decision |
|---|---|
| What video the learner wants to watch next. | Show those videos in the recommendation bar. |
| Probability someone will click on a search result. | If P(click) > 0.12, prefetch the web page. |
| What fraction of a video ad the user will watch. | If a small fraction, don’t show the user the ad. |